×
  • Go Back
  • Save

  • Share

  • Add Note

  • Email

  • Print

  • Save

  • undefined
    undefined
    undefined

    $17,500 Active

    Est. Payments $91/mo
  • sq. Ft
  • Additional Details Plus Icon

    Meet your Agent

    Tucker Customer Care, REALTOR®/Broker, F. C. Tucker Company
    Tucker Customer Care
    F.C. Tucker Company
    (317) 954-4768

    Description

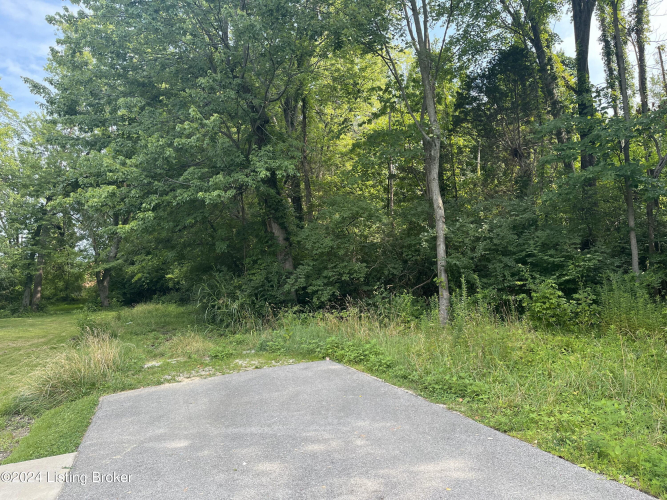
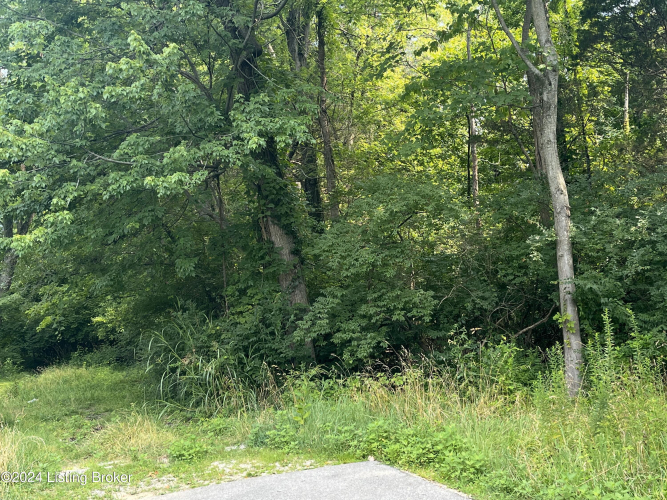
    Lot Dimensions and Frontage to be verified by Buyer. Utilities are accessible at the last home on Lynnhurst Drive...


    Map View

    Street View Not Available At this Location


    Mortgage Calculator

    Price & Interest: $91/month
    Property Tax: $0/month
    MTG INS: $0/month
    HOME INS: $7/month
    Down Payment
    $0
    Down Payment %
    0 %
    Home Owner Insurance
    $84 / year
    Property Taxes
    $0/month
    HOA Dues
    $0 / Month
    Interest Rate
    4.75 %
    Mortgage Ins.
    $0 / year
    Years
    30 Years
    Loan Price
    $98
    Price And Interest $91/month
    Property Tax $0/month
    MTG INS $0/month
    HOME INS $7/month
    Price And Interest:  $91/month
    Property Tax:  $0/month
    MTG INS:  $0/month
    HOME INS:  $7/month

    Schedule A Video Tour

    Looking to find your perfect place without leaving the comfort of your home? Schedule a personalized video tour with one of our expert agents! Whether you’re a first-time buyer or on the hunt for your next investment, our agents will give you an in-depth, real-time walkthrough, answering all your questions and showing you every detail of the property

    Reserve

    Listing provided courtesy of Melanie Jones and Jared Greene with Keller Williams Louisville East

    The data relating to real estate for sale on this web site comes in part from the Internet Data Exchange Program. Real estate listings held by IDX Brokerage firms other than F.C. Tucker Company include the name of the listing IDX broker. This information is provided exclusively for personal, non-commercial use and may not be used for any purpose other than to identify prospective properties consumers may be interested in purchasing. The broker providing this data believes it to be correct, but advises interested parties to confirm them before relying on them in a purchase decision. Information deemed reliable but is not guaranteed.

    Active
       Lyndon, KY 40222

    8409 Roland Ave

    $12,500

    Active
       Lyndon, KY 40222

    325 Camelia Ave

    $10,000

    Active
       Lyndon, KY 40222

    331 Camelia Ave

    $10,000


    Lyndon, KY Market Report

    118
    Avg. DOM
    $204.31
    Avg. $ / Sq.Ft.
    $ 326,200
    Med. List Price

    The house prices in Lyndon are indeed dropping at the moment. There has been a decrease in price of $49,000.00. There are several factors that can cause a price drop. Higher mortgage rates, lower demand, prices of comparable properties can all cause the price of a house to drop.

    The housing market and house prices in Lyndon are going Down. The average house price is $326,200.00 and the average price per square feet is $205.13 per square feet. At the moment, the amount of homes listed is exactly 37 houses, with 4 with active status, 1 with pending status and 32 sold in Lyndon .

    The most popular place to buy a home in Lyndon is 08-DglasHls/Hurstbrn/Mdltwn/Anchrg/StMatt. 08-DglasHls/Hurstbrn/Mdltwn/Anchrg/StMatt is where we have the most properties listed and there seems to be the most demand to buy a house. Some people love to live in the most popular areas of a city, and others prefer to live in an area that is less busy. Regardless of your preference, we have a vast variety of listings and agents to help you find a house in Lyndon .

    The average amount of property taxes you would have to pay for a home in Lyndon is $0.00. It is important to consider property taxes when purchasing a home. Property taxes are tied to the value of the home. The more expensive the home is, the higher the taxes will be.

    Properties in Lyndon are staying listed for an average of 47 days. A good way to tell if you are in a buyer's or seller's market is to look at the average days on market for homes in the area. A low number of average days on market indicate a seller's market whereas a high number of average days on market indicate a buyer's market.

    The last home listed in Lyndon was 94358 minutes ago.

    At the moment we have 0 open houses that you can visit.

    The cost of the most expensive home in Lyndon is $405,000.00. There are several reasons to consider buying an expensive home. They typically have great amenities, will be in great condition, and have plenty of space inside and outside of the home. Expensive real estate usually appreciates very fast, making it a good investment if you can afford it.

    The cost of the cheapest home in Lyndon is $299,900.00 . Buying a cheap house can have many benefits including keeping your payments low, allowing more room in your budget to customize or improve the house, as well as allowing you to pay of your mortgage faster.

    The date of the oldest built home in Lyndon in year 1954 and the newest built house is in year 2024.

    The average size of properties in Lyndon is 1702.25 sq.ft. , the biggest one being 2375 sq.ft. and the smaller being 1332 sq.ft. . The size of your family and budget are important factors to consider when purchasing a home.